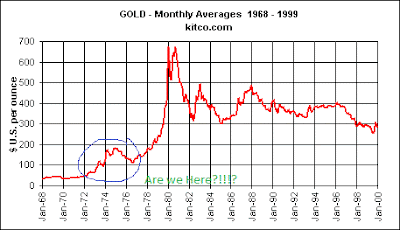
April 1974, the US abandon the gold standard and giving up fixed exchange rates. Gold price actually did not spike for more than two years later. Gold going from $35 to $180 (5x) then drop back to $120 (3.5x) before going to $650 (18x).
The chart below is the gold price of the last 10 years. This two charts look dangerously similar in the first segment. Suggesting the increase in gold price is only the beginning. The driving factor here are fiscal irresponsibility and corrupt monetary policies.
The following scenarios used historical trends to project the current gold price development. Yes yes, there is no solid technical analysis here or scientific proof. It i just a plain observation that I thought was quite interesting to note.
Scenario One:
With the low of $250. Gold went up to $1000 (4x) before dropping to $750 (3x) and continue to 18x. That would be shine of $5000.
Scenario Two:
With the low of $300, Gold went up to $1450 (5x), which was NOW. Then it might drop to 3.5x = $1050 before going up to 18x = $5800.
Let's see how bad does it get.

